2023 Safety Benchmarking Survey Now Open
You are invited to participate in Safety Action’s 2023 safety performance benchmarking project. All participants receive a free copy of the full report.
Per last month’s article on Measuring Safety, read here, there is a long standing debate in safety industry about the best ways to measure safety.
Should we still measure lag indicators, e.g. LTI, MTI, TRI, after the fact data which is often seen as a measure the lack of safety?
Should we measure the undertaking of safety activities, called lead indicators e.g. percentage of inspections conducted on time, audits score, employee survey.
Each method has its pros and cons with little agreed standard across industry. And we believe both have their place. Lag indicators are viewed as standard for historical reasons, but also allow comparison across businesses. Whilst lead indicators are viewed as serving a higher internal value of ensuring safety activities are performed, which is then thought to improve safety.
Rate yourself
Strong safety performance is commonly linked to improved business performance. Do you know if your performance is above or below average for Australia or your industry?
Learn your businesses strengths and areas for improvement.
Use your personalised report to set realistic targets for safety improvement.
Compare lead and lag indicators and safety activities and initiatives that link to better performance.
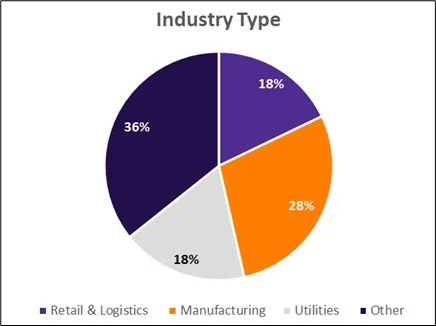
2022 Participants per industry
What we learn from benchmarking
Last survey* identified TRI’s were the only trending data, with LTIs and MTIs have no statistically observable trends or relationship with activities.
A correlation was identified between injury data (TRIFR) reduction and the following activities being undertaken;
Existence of a key risk register
Presence of a 5-10year safety plan
3 years safety audits
This data has been consistent over the last two surveys. And it will be interesting to find out if this remains the same for another year.
*Safety Benchmarking report dated 2022.
Participation
Participate online by completing 20 YES/NO questions and provide data on 10 safety performance lead and lag indicators.
Takes less than 10 minutes to complete.
All participants receive a free copy of the full report. The report will include de-identified business results in summary form*, industry breakdowns, comparison of safety activities and initiatives, prosecutions summary by state, plus participants will additionally receive their own personalized report allowing them to know their businesses stance within all the data.
*All data is kept confidential and only used for data analysis used in this report only.


